Measuring Exhibition Success: Metrics for Attendance, Engagement, and Sales
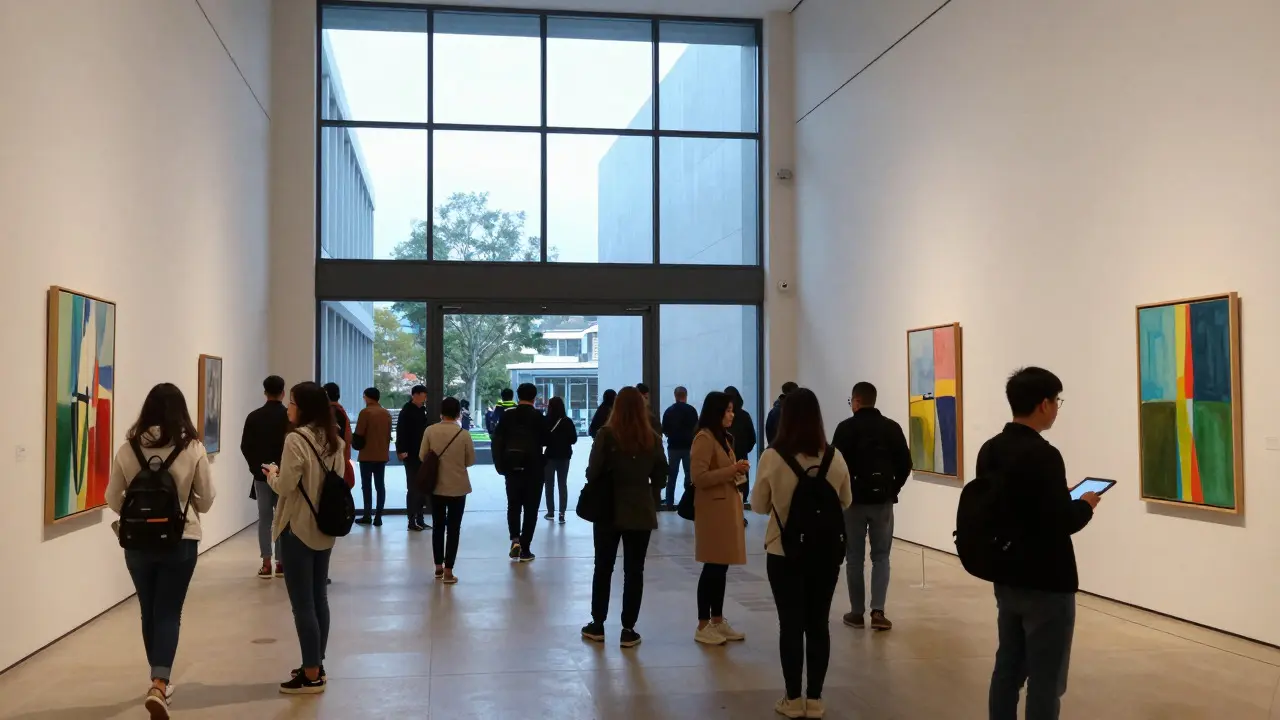
Walking out of a gallery with a sold-out piece feels great, but does it actually mean the show was a success? Not necessarily. You might have had low foot traffic, minimal social buzz, or no repeat visitors. Relying on gut feeling is risky when budgets are tight. To know if your next exhibition will work, you need hard numbers. This guide breaks down how to measure exhibition success using three core pillars: attendance, engagement, and sales.
Why Gut Feelings Fail in Art Curation
Curators often judge a show by its aesthetic impact or critical reception. While important, these are subjective. A show can be critically acclaimed yet financially disastrous. Conversely, a commercial blockbuster might lack depth but generate significant revenue. The problem isn't choosing between art and commerce; it's ignoring the data that connects them.
Without standardized metrics, comparing one exhibition to another is impossible. Did the summer show perform better than the winter one? Only if you define "better." Is it about ticket sales? Member sign-ups? Or brand awareness? Each goal requires different tracking methods. By establishing clear KPIs (Key Performance Indicators) before the doors open, you turn vague impressions into actionable insights.
Pillar 1: Measuring Attendance Beyond Headcount
Attendance is the most basic metric, but simply counting heads at the door is outdated. Modern exhibition analysis looks at Visitor Flow Patterns, which track how long people stay and where they go inside the space.
- Total Visitors: The raw number of unique individuals who entered during the run period.
- Dwell Time: Average time spent in the gallery. A high headcount with low dwell time suggests people passed through without engaging.
- Peak Hours: Identifying when crowds arrive helps optimize staffing and opening hours for future events.
- Demographics: Age, location, and occupation data help align marketing efforts with actual attendees rather than assumed audiences.
Use digital tools like RFID badges, Wi-Fi heatmaps, or simple QR code scans at entry points to capture this data. If you don't have tech infrastructure, timed manual counts every hour still provide valuable flow data. The goal is to understand not just *who* came, but *how* they moved through your space.
Pillar 2: Quantifying Engagement and Interaction
Engagement measures how deeply visitors connect with the content. It’s the bridge between seeing an artwork and understanding or feeling something about it. High engagement often predicts higher sales and stronger brand loyalty.
How do you measure feelings? You proxy them through behavior. Track interactions with specific works, participation in events, and digital activity.
For example, if 80% of visitors photograph a specific installation, that piece is likely a highlight. If only 5% attend the curator talk despite high general attendance, your promotion for that event may have failed. Combine these signals to identify what resonated and what didn’t.

Pillar 3: Calculating Sales and Financial ROI
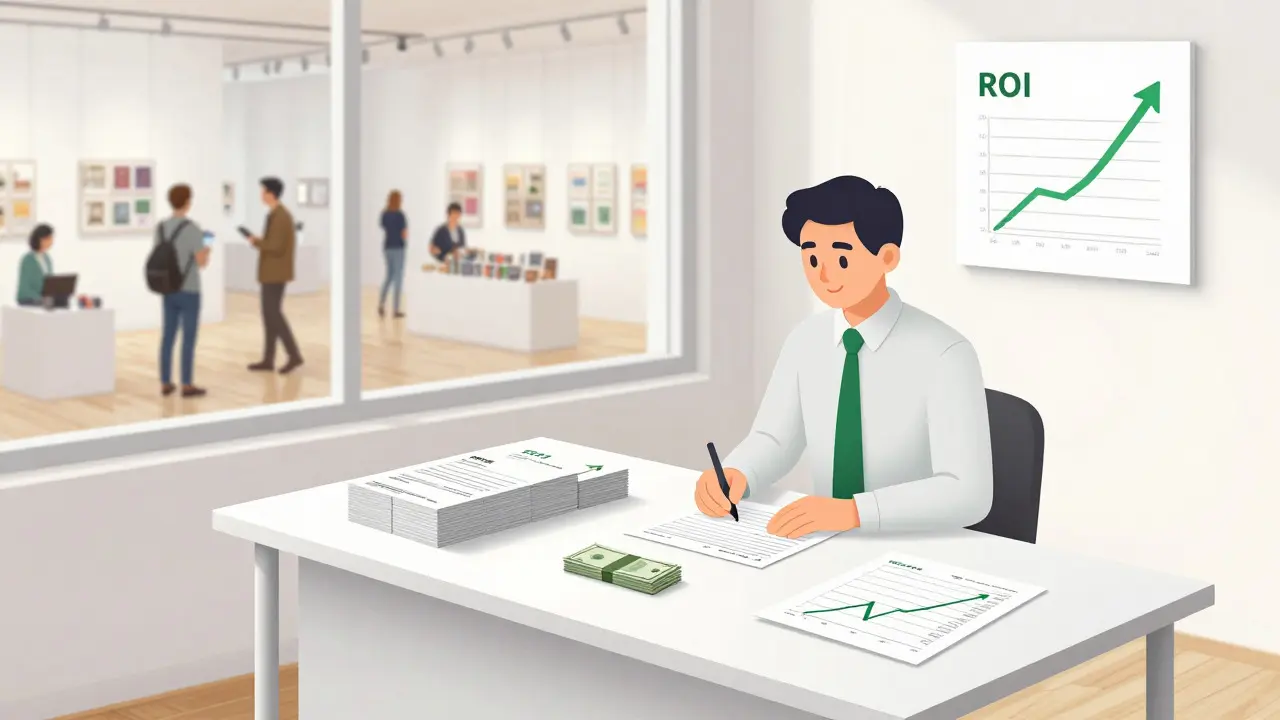
For galleries and museums with shops, sales are the bottom line. But calculating Return on Investment (ROI) for an exhibition involves more than subtracting costs from revenue. You must account for indirect benefits like membership growth and grant eligibility.
The basic formula for direct ROI is:
- Total Revenue (Ticket Sales + Merchandise + Donations)
- Minus Total Direct Costs (Artist fees, shipping, insurance, marketing, staff overtime)
- Divide by Total Direct Costs
- Multiply by 100 to get a percentage
A positive ROI means the show paid for itself directly. However, many non-profit exhibitions aim for break-even while gaining intangible value. In those cases, track Membership Conversion Rates. If 10% of first-time visitors become members, that has long-term financial value beyond the exhibition window.
Building Your Data Collection Strategy
You don’t need expensive software to start measuring effectively. Start with free or low-cost tools and consistent habits.
- Pre-Show: Define your top 3 goals. Are you aiming for record attendance, new member acquisition, or specific artwork sales?
- During Show: Assign staff to log hourly counts and note peak times. Use a simple spreadsheet or app to record survey responses from exit polls.
- Post-Show: Compile all data within one week while memories are fresh. Compare actual results against pre-set goals.
Consistency is key. If you measure dwell time in January, do it in July too. Comparing apples to oranges ruins your insights. Standardize your methods so year-over-year comparisons are valid.
Common Pitfalls to Avoid
Many curators make mistakes that skew their data. Watch out for these traps:
- Ignoring Seasonality: Summer shows naturally draw more crowds than winter ones. Adjust expectations accordingly.
- Overvaluing Social Media: A viral post doesn’t always equal in-person engagement. Check if online buzz translated to foot traffic.
- Neglecting Qualitative Feedback: Numbers tell you *what* happened, but comments tell you *why*. Read your comment books carefully.
- One-Off Metrics: A single high-sales day doesn’t guarantee overall success. Look at trends across the entire run.
Also, remember that small sample sizes can be misleading. If only five people bought merchandise, one large purchase skews the average significantly. Focus on percentages and trends rather than isolated incidents.
Turning Data Into Better Curation
Metrics are useless if you don’t act on them. After analyzing your exhibition, ask: What worked? What didn’t? How can we improve next time?
If dwell time was low near the entrance, consider moving high-interest pieces closer to the front. If social engagement was high but sales were low, maybe your pricing strategy needs adjustment. If membership conversion was poor, test different call-to-actions during the tour.
Document these lessons in a post-mortem report. Share it with your team. Over time, this creates a knowledge base that makes each subsequent exhibition smarter and more profitable. Data transforms curation from an art form alone into a strategic discipline.
Frequently Asked Questions
What is the ideal dwell time for an art exhibition?
There is no universal standard, but for a typical gallery show, 15-30 minutes is considered healthy. If visitors leave in under 10 minutes, the content may not be engaging enough. If they stay over an hour, ensure they aren't getting lost or bored. Use your own historical data to establish a baseline for your specific venue and audience.
How do I calculate ROI for a non-profit exhibition?
Non-profits should include indirect values in their ROI calculation. Add the estimated lifetime value of new members, increased donor interest, and earned media value to the direct revenue. Subtract total costs from this combined figure to get a holistic view of financial health, even if ticket sales alone show a loss.
Is social media engagement a reliable indicator of exhibition success?
It is a useful supplementary metric, but not a primary one. Social media reflects reach and brand visibility, which are long-term assets. However, high online engagement doesn't guarantee high physical attendance or sales. Always cross-reference social data with in-person metrics to see if digital buzz translates to real-world action.
What tools are best for tracking visitor demographics?
Simple exit surveys with multiple-choice questions are cost-effective and yield good demographic data. For larger venues, Wi-Fi analytics platforms or ticketing systems with optional profile fields can automate this process. Ensure you comply with local privacy laws when collecting personal data, such as age or location.
How often should I review exhibition metrics?
Monitor daily or weekly during the active run to catch issues early, such as low attendance on weekdays. Conduct a full deep-dive analysis immediately after the show closes. Then, revisit the data quarterly to spot longer-term trends and compare performance across different seasons or themes.