Key Performance Indicators for Gallery Operations: A Practical Guide

Running an art gallery isn't just about hanging beautiful frames; it's a business that runs on data. If you're not tracking the right numbers, you're guessing. Key Performance Indicators (KPIs) are specific, measurable values that demonstrate how effectively a gallery achieves its key business objectives. For most independent spaces, these metrics fall into three buckets: financial health, visitor engagement, and operational efficiency.
You don't need to track fifty different stats. You need five or six that tell you if the lights are on, if people are coming in, and if they are buying. This guide breaks down exactly which numbers matter, why they matter, and how to calculate them without getting lost in spreadsheets.
The Financial Bottom Line
Before anything else, you need to know if the money is working. The most critical metric here is your Gross Margin per Sale. Unlike retail stores that sell thousands of low-cost items, galleries deal with high-ticket, low-volume transactions. Your margin isn't just the difference between cost and price; it includes the artist's split, shipping, insurance, and framing costs.
Let’s look at a real scenario. Suppose you sell a painting for $5,000. The artist takes 50% ($2,500). Shipping and insurance cost $300. Framing was $200. Your actual profit is $2,000. That’s a 40% gross margin. If you only looked at the revenue, you’d think you made $5,000. But if your rent is $8,000 a month, you need to understand that true profitability requires selling roughly four of those pieces just to cover rent, before paying staff or marketing.
Another vital financial indicator is Inventory Turnover Rate. This tells you how fast you’re moving art off the walls. In the commercial art world, stagnant inventory is dead weight. It ties up capital and takes up physical space. A healthy turnover rate for a contemporary gallery might be one where 60-70% of exhibited works sell within the exhibition period (usually 6-8 weeks). If you have pieces sitting for three months, your cash flow is suffering, and you’re paying storage fees for work that isn’t generating interest.
Visitor Engagement and Traffic
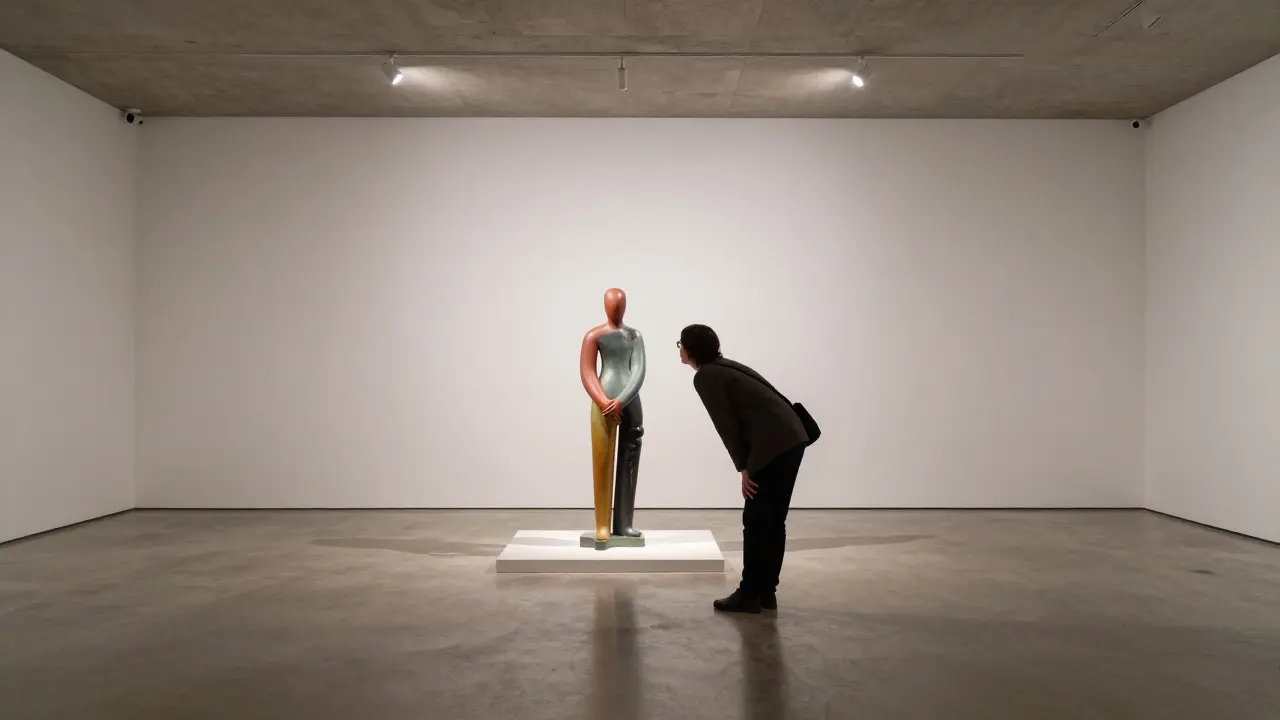
Money follows attention. If nobody walks through the door, no one buys. The primary metric here is Unique Visitor Count, but raw foot traffic can be misleading. You need to segment this data. How many visitors came during opening night versus a random Tuesday afternoon? Opening nights often skew numbers because they attract socialites rather than buyers. A more useful metric is Average Dwell Time.
Dwell time measures how long a person stays in the gallery. If someone lingers for 15 minutes, they are engaged. If they walk in, glance around, and leave in 90 seconds, they are likely just passing by or looking for restrooms. You can measure this manually with spot checks or use simple sensor technology. A strong correlation exists between dwell time exceeding 10 minutes and purchase probability. When you see a drop in average dwell time after changing your lighting or layout, you have immediate feedback that something feels off to the viewer.
Don’t ignore Digital-to-Physical Conversion either. Most modern galleries maintain a website or Instagram presence. Track how many online inquiries result in a physical visit. If your Instagram has 10,000 followers but only two people come to the studio tour, your digital content isn’t translating to local intent. Use unique URLs for email campaigns or QR codes in print ads to trace exactly which channels drive foot traffic.
Sales Conversion and Customer Value
Getting people in the door is step one. Getting them to buy is step two. The standard retail metric is Sales Conversion Rate, calculated as (Number of Sales / Number of Visitors) x 100. In high-end art, this number is naturally lower than in clothing retail. A 2-5% conversion rate for serious collectors is considered healthy. However, for smaller works or prints, you might aim higher. If your conversion rate drops below 1%, investigate whether the pricing is misaligned with the audience or if the curation lacks cohesion.
Beyond the percentage, look at Average Transaction Value (ATV). This is the total revenue divided by the number of transactions. If your ATV is dropping, are you selling more small works and fewer large pieces? Or are you discounting heavily to move inventory? Tracking ATV helps you understand the mix of your sales. A gallery specializing in large-scale abstracts should expect a much higher ATV than a print shop. Deviations from your historical ATV baseline signal shifts in buyer behavior or market trends.
Finally, consider Customer Lifetime Value (CLV). Art collecting is often a lifelong habit. A client who buys one piece today may return in five years for another. CLV estimates the total revenue a customer will generate over their relationship with your gallery. While harder to calculate precisely, even a rough estimate helps justify spending on relationship management, like personalized follow-up emails or invitations to private viewings. Acquiring a new collector costs significantly more than retaining an existing one, so knowing your CLV prioritizes your marketing budget toward retention strategies.
Operational Efficiency and Space Utilization
Galleries are expensive real estate. Every square foot must earn its keep. The key metric here is Revenue per Square Foot. Divide your monthly revenue by your total usable square footage. This number allows you to compare performance across different locations or exhibitions. If a particular zone of your gallery consistently underperforms, maybe the lighting is poor there, or the artwork doesn’t fit the aesthetic. Moving high-performing pieces to low-revenue zones can boost overall output without increasing marketing spend.
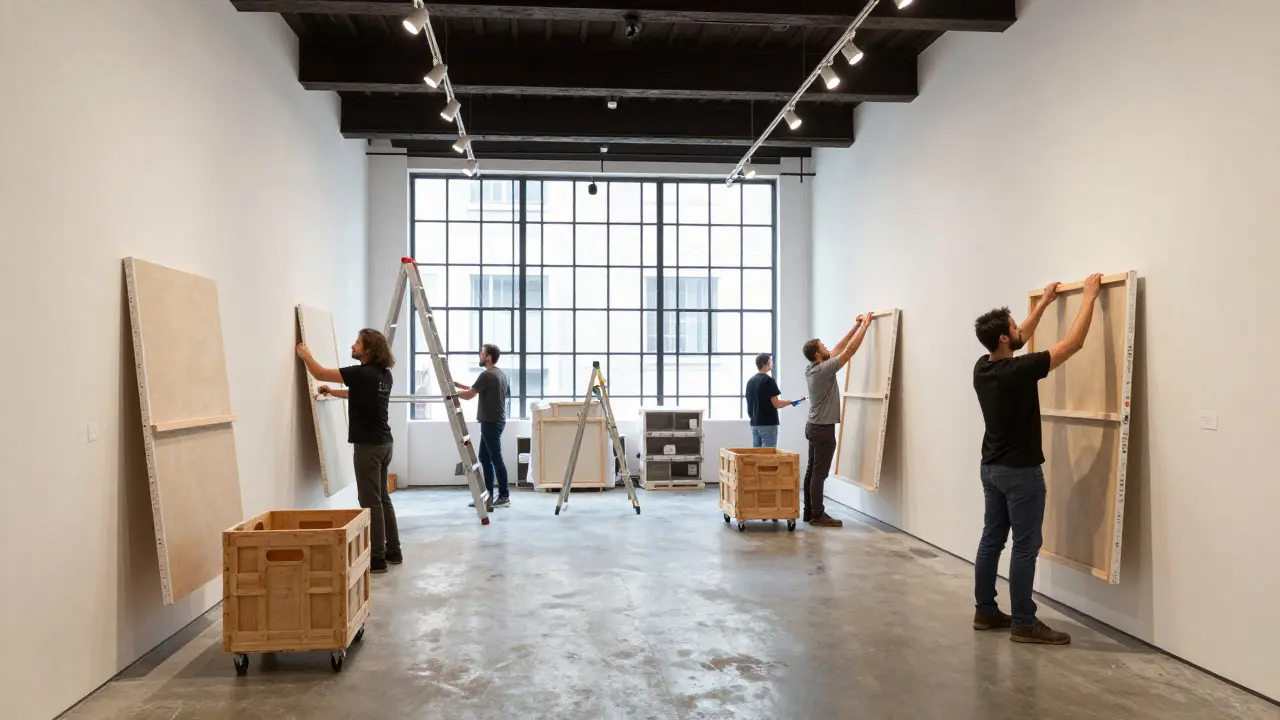
Also track Exhibition Changeover Time. This is the number of hours required to take down one show and install the next. Inefficient changeovers mean lost rental income or delayed openings. A well-oiled operation targets a specific timeframe, say 48 hours for a full gallery reset. If you’re taking seven days, you’re losing potential revenue. Document every step of the process to identify bottlenecks, such as waiting for crates or coordinating with installers.
| KPI Name | Category | Calculation Method | Ideal Benchmark (Contemporary) |
|---|---|---|---|
| Gross Margin per Sale | Financial | (Revenue - Direct Costs) / Revenue | 40-60% |
| Inventory Turnover | Financial | Cost of Goods Sold / Average Inventory | 1.5x - 2x per year |
| Average Dwell Time | Engagement | Total Visit Duration / Total Visitors | > 10 minutes |
| Sales Conversion Rate | Sales | (Sales / Visitors) x 100 | 2-5% |
| Revenue per Sq Ft | Operations | Total Revenue / Usable Area | Varies by location |
How to Implement These Metrics Without Overwhelm
You don’t need enterprise software to track these. Start with a simple spreadsheet updated weekly. Assign one person-ideally the gallery manager-to own the data collection. Consistency matters more than complexity. If you track Gross Margin every month but forget to log Visitor Counts, you lose the ability to correlate traffic with sales.
Set realistic baselines first. Look at your last twelve months of data. What was your average conversion rate? What was your typical dwell time? These become your control points. Then, set modest improvement goals. Aim to increase dwell time by 1 minute or improve conversion by 0.5% in the next quarter. Small, incremental gains compound over time.
Review these KPIs in monthly meetings. Don’t just present the numbers; discuss the context. Did we have a rainy week that lowered foot traffic? Did we feature a particularly popular artist that boosted sales? Context turns data into insight. Without context, a drop in sales looks like failure; with context, it might reveal a seasonal trend you can plan for.
Frequently Asked Questions
What is the most important KPI for a new gallery?
For a new gallery, Cash Flow and Gross Margin are paramount. You need to ensure every sale covers its direct costs and contributes to overhead. Focus on Inventory Turnover to avoid tying up capital in unsold work while you build your reputation.
How do I measure dwell time accurately?
You can use manual spot checks where staff note entry and exit times for a sample of visitors. Alternatively, basic Wi-Fi tracking or heat-map sensors can provide automated data. Even a simple counter at the door combined with exit logs can give you a reliable average over time.
Is a low conversion rate always bad?
Not necessarily. High-end galleries often have lower conversion rates because the average ticket size is huge. If your Average Transaction Value is very high, a 1% conversion rate can still generate significant revenue. Always look at conversion rate alongside ATV and Gross Margin.
How often should I update my KPI dashboard?
Update raw data daily or weekly, but review the aggregated KPIs monthly. Daily reviews can lead to noise-chasing. Monthly reviews allow you to smooth out weekly fluctuations and see clearer trends related to exhibitions or seasons.
Do I need special software to track these metrics?
No. Excel or Google Sheets are sufficient for most independent galleries. As you scale, you might integrate your Point of Sale system with a BI tool, but starting with manual tracking ensures you understand the underlying logic before automating it.