How to Measure Walkability Scores for Gallery Locations
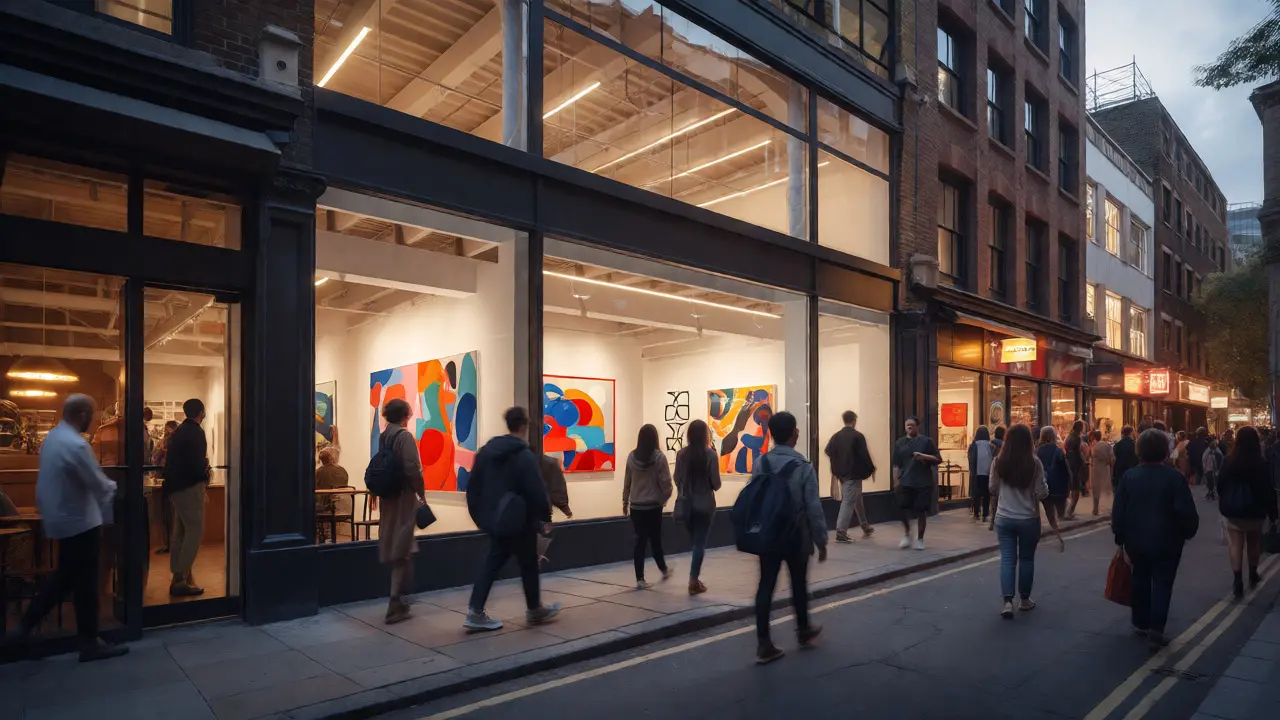
You’ve found the perfect loft. High ceilings, north-facing light, and a rent that doesn’t require selling a minor piece of your collection. But before you sign that lease, ask yourself: will anyone actually walk past it? In the art world, visibility is currency. A gallery tucked away in a dead zone might look great on Instagram, but if foot traffic is zero, sales follow suit. That’s where walkability scores come into play. They aren’t just numbers for tourists; they are hard data points that predict whether your physical space can sustain a business.
Think about the last time you visited a museum district or a trendy arts quarter like Chelsea in New York or Shoreditch in London. You didn’t drive there. You walked from a coffee shop, then to another gallery, then maybe grabbed lunch. This clustering effect isn’t accidental. It’s driven by infrastructure that makes walking easy, safe, and pleasant. If you’re scouting locations for a new exhibition space, ignoring these metrics is like buying a car without checking if it has an engine. Let’s break down how to measure them properly so you don’t end up paying premium rent for a ghost town.
Why Walkability Matters More Than Square Footage
Real estate agents love talking about square footage. For a gallery owner, that metric is often irrelevant compared to proximity. Art is experiential. People need to stumble upon it. When we talk about gallery locations, we are really talking about human flow patterns. A high Walk Score indicates that daily errands do not require a car. For a gallery, this translates directly to potential visitors who are already out and about, not those making a special trip.
Data from the National Association of Realtors suggests that properties with higher walkability scores hold their value better during market downturns. Why? Because demand for walkable urban living remains resilient. For galleries, this resilience means a steady stream of curious passersby rather than relying solely on destination visits. If your location scores below 50 on standard indices, you are effectively invisible to the casual browser. You become a destination-only venue, which requires significantly more marketing spend to attract the same number of eyes as a location scoring above 80.
Decoding the Metrics: What Actually Goes Into the Score
It’s easy to glance at a number on a map app and move on. But understanding the components helps you spot hidden gems or red flags. The most common tool used globally is Walk Score. It calculates a value from 0 to 100 based on three main factors: distance to amenities, population density, and street connectivity.
- Amenity Proximity: How close are cafes, restaurants, transit stops, and shops? Galleries thrive near lifestyle anchors. If people walk to get coffee, they might walk five minutes further to see art.
- Street Connectivity: Are there direct paths, or do you have to go around blocks? Grid-like streets usually score higher because they offer multiple entry points.
- Population Density: Higher density generally means more foot traffic. However, this must be balanced with the quality of the pedestrian environment.
Another critical metric is the Pedestrian Death Index. Yes, safety matters. If pedestrians feel unsafe crossing wide avenues or navigating poorly lit sidewalks, they won’t linger. A location might have high density but low perceived safety, leading to a "drive-through" culture where people rush home instead of browsing windows.

Tools and Data Sources for Real Estate Analysis
You don’t need a PhD in urban planning to get this data. Several platforms aggregate municipal data, satellite imagery, and user reviews to generate these scores. Here is what you should be using:
| Tool Name | Primary Focus | Best For | Limitations |
|---|---|---|---|
| Walk Score | Consumer-friendly accessibility | Quick initial screening of neighborhoods | Doesn't account for specific commercial tenant mix |
| Transit Score | Public transport access | Galleries targeting commuters or tourists | Ignores short-distance walking convenience |
| Bike Score | Cycling infrastructure | Areas with strong bike culture (e.g., Amsterdam, Portland) | Less relevant for non-cyclist demographics |
| Local Municipal GIS | Zoning and detailed street data | Deep dive into specific block-level activity | Requires technical knowledge to interpret raw data |
While Walk Score gives you the headline number, digging deeper into local municipal GIS (Geographic Information Systems) maps can reveal zoning changes. Is that empty lot next door zoned for a new luxury apartment complex? That future influx of residents could boost your baseline traffic by 20% in two years. Conversely, is there a plan to widen the road? That might kill the sidewalk vibe.
The "Art District" Effect: Clustering vs. Isolation
There is a phenomenon known as agglomeration economies. In simple terms, businesses benefit from being near similar businesses. For galleries, this is profound. Being part of a recognized arts district increases credibility and visitor volume exponentially. Think of the Meatpacking District in NYC or the Wynwood Walls in Miami. These areas weren't always hubs; they became ones because early adopters clustered together, drawing attention and infrastructure.
When measuring walkability for a gallery, you must assess the "cluster strength." Are there other cultural institutions nearby? Museums, theaters, and independent bookstores act as traffic generators. A single gallery on a lonely street needs to work ten times harder to justify its existence compared to one situated between a popular museum and a bustling restaurant row. Use heat maps from social media check-ins (like Foursquare or Instagram geotags) to visualize where people actually congregate, not just where the roads are.
Pitfalls: When High Scores Lie
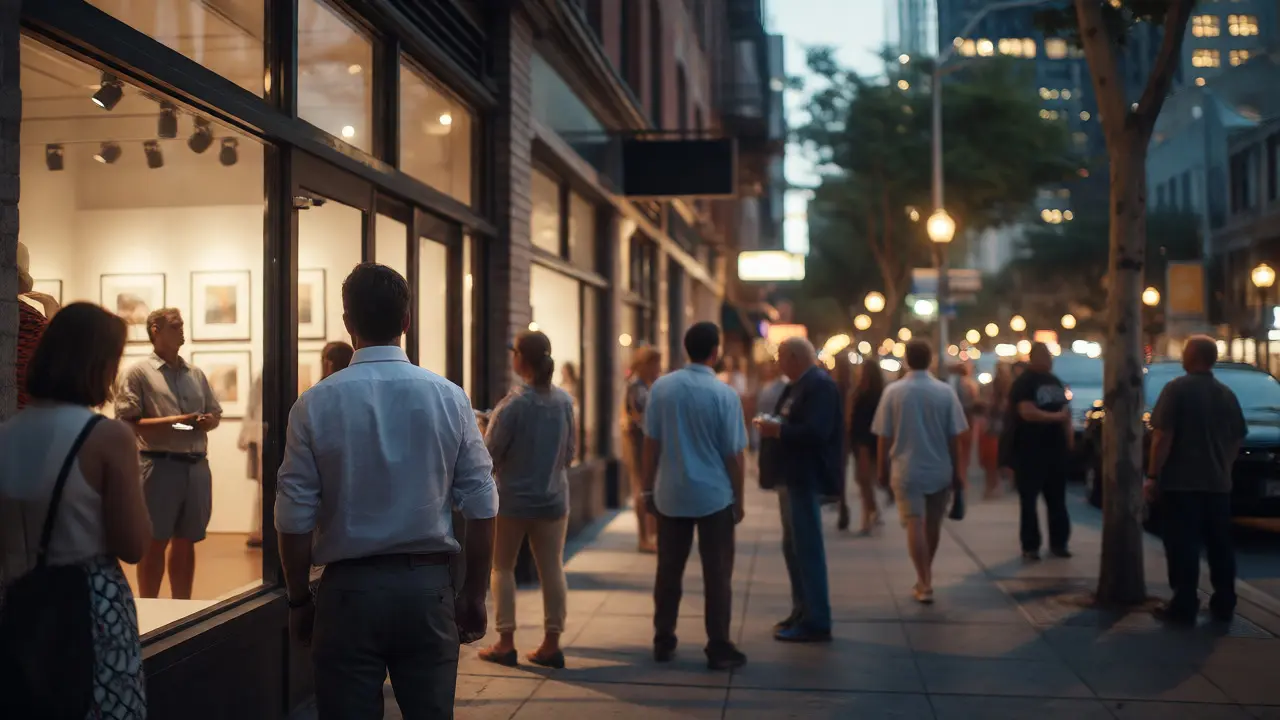
Don’t trust the algorithm blindly. A high walkability score can sometimes mask poor commercial viability. Here are three traps to watch out for:
- The Commuter Trap: A neighborhood might score 90+ because everyone walks to the subway station in the morning and leaves in the evening. But between 10 AM and 4 PM, the streets are deserted. Visit the location at different times of day. Count the actual humans on the sidewalk, not just the theoretical ones.
- The Gentrification Lag: New developments often have high walkability scores due to planned amenities that haven’t opened yet. You might be leasing space in a "future" hotspot that is currently a construction site. Check the occupancy rates of neighboring retail units. If they are dark, your score is aspirational, not actual.
- Weather and Seasonality: In cities like Chicago or Toronto, winter weather drastically reduces walkability despite high scores. In contrast, Mediterranean climates maintain consistent pedestrian flow year-round. Adjust your expectations based on local climate realities.
Actionable Steps for Your Next Lease Negotiation
Armed with this data, you can negotiate better terms. Landlords in high-walkability zones know their asset is valuable, but they also know that commercial tenants bring prestige and activation to the ground floor. Use your analysis to demonstrate why you are a good fit.
- Request Traffic Data: Ask the landlord for existing pedestrian count studies. Many city transportation departments publish free annual counts. Compare these numbers to the national average for retail corridors.
- Negotiate Signage Rights: If the walkability score is high but visibility is blocked by trees or buildings, negotiate for prominent exterior signage rights. Visibility is the bridge between foot traffic and store entry.
- Leverage Community Events: Propose hosting open studio nights or first-Friday events. Show the landlord that your presence will activate the space, potentially increasing the value of their adjacent properties.
Ultimately, choosing a gallery location is about balancing cost against opportunity. A slightly lower rent in a mediocre walkability zone might seem attractive, but the marketing costs to draw people there often exceed the savings. By rigorously measuring walkability, you turn a subjective guess into a calculated business decision. You’re not just renting walls; you’re buying access to the public’s feet.
What is considered a good walkability score for a gallery?
Generally, a score of 70 or above is considered "very walkable" and is ideal for retail and commercial spaces like galleries. Scores between 50 and 69 are "somewhat walkable," meaning some errands can be accomplished on foot, but many require a car. Below 50, you are heavily reliant on customers making a dedicated trip, which increases marketing costs.
Do walkability scores account for crime rates?
Standard algorithms like Walk Score do not directly factor in crime statistics. However, perceived safety influences actual behavior. Some advanced tools incorporate police report data or use proxy metrics like lighting levels and active storefronts. Always cross-reference walkability scores with local crime maps and visit the area at night to assess personal comfort levels.
Can I improve my gallery's effective walkability score?
You cannot change the official algorithmic score, but you can improve the practical experience. Enhance your exterior lighting, ensure clear signage, create inviting window displays, and host regular community events. By activating your space, you encourage neighbors to walk past and enter, effectively boosting your local foot traffic regardless of the static score.
Is bikeability important for gallery locations?
Yes, increasingly so. Cities with robust cycling infrastructure, such as Copenhagen or Portland, see significant patronage from cyclists. A high Bike Score indicates safe lanes and secure parking options. If your target demographic includes young professionals or students, bikeability can be a deciding factor in choosing a location over one with only high pedestrian scores.
How does transit access affect gallery foot traffic?
Proximity to major transit hubs expands your catchment area significantly. While walkability covers immediate neighbors, transit access brings in visitors from across the city or even tourists. A gallery within a 5-minute walk of a subway or train station typically sees higher weekend traffic and broader demographic reach compared to one accessible only by bus or car.